What is ImmersivePoints? 🧐
ImmersivePoints is an application which displays your 3D data in virtual reality.It is supported by virtual reality headers for your PC, and stand-alone headsets such as the oculus quest.
You can either visualise data on your own server, or upload data to my server on the upload page.
Getting started with your own data is easy: take a look at these programming examples.
View examples of virtual reality data

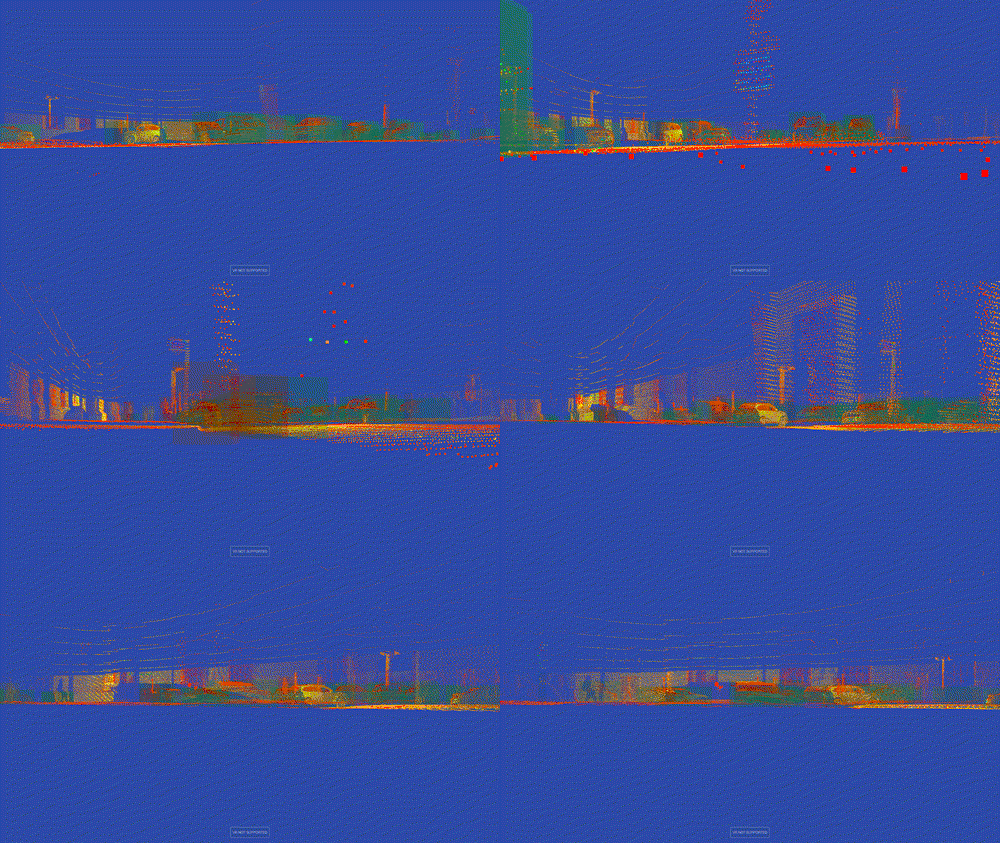
What a self-driving car sees with it's LiDAR scanner. This frame is taken from the A2D2 dataset

A brain with some information of a clustering algorithm

The notre dame. Taken from this point scan

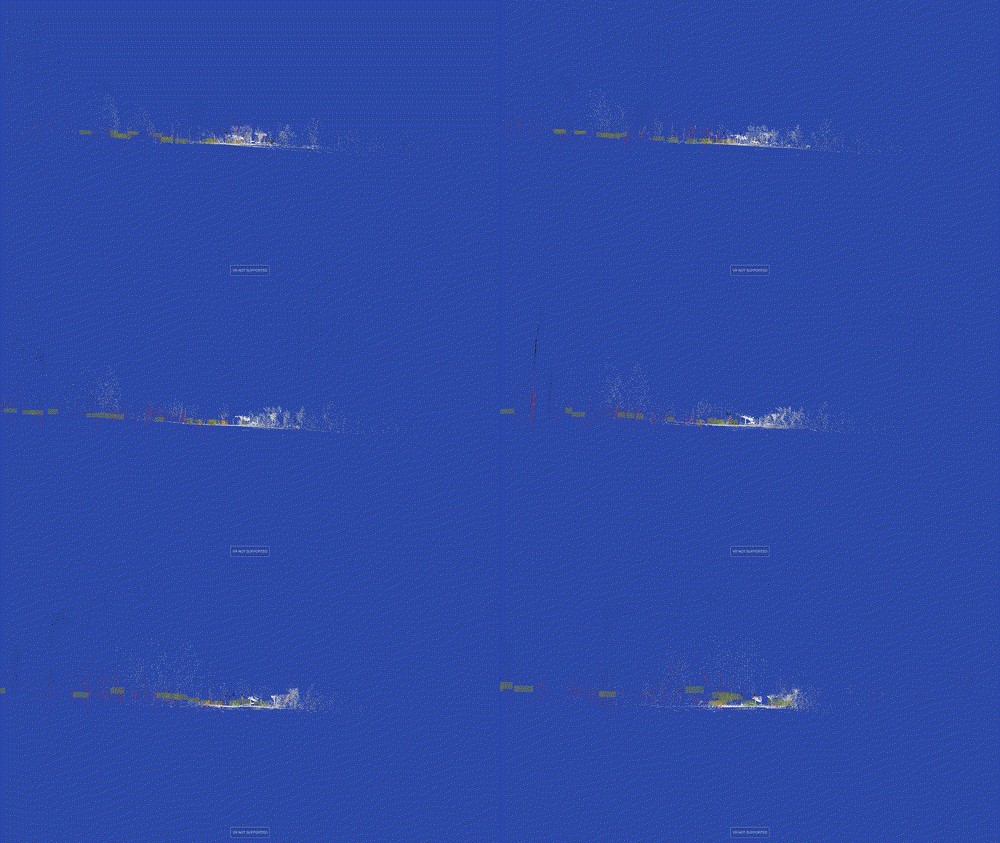
Astyx LiDAR + Radar Dataset: Real automotive sensor fusion data with RGB colors from LiDAR reflectivity and 3D bounding boxes. Dataset from Astyx for autonomous driving research. Read more

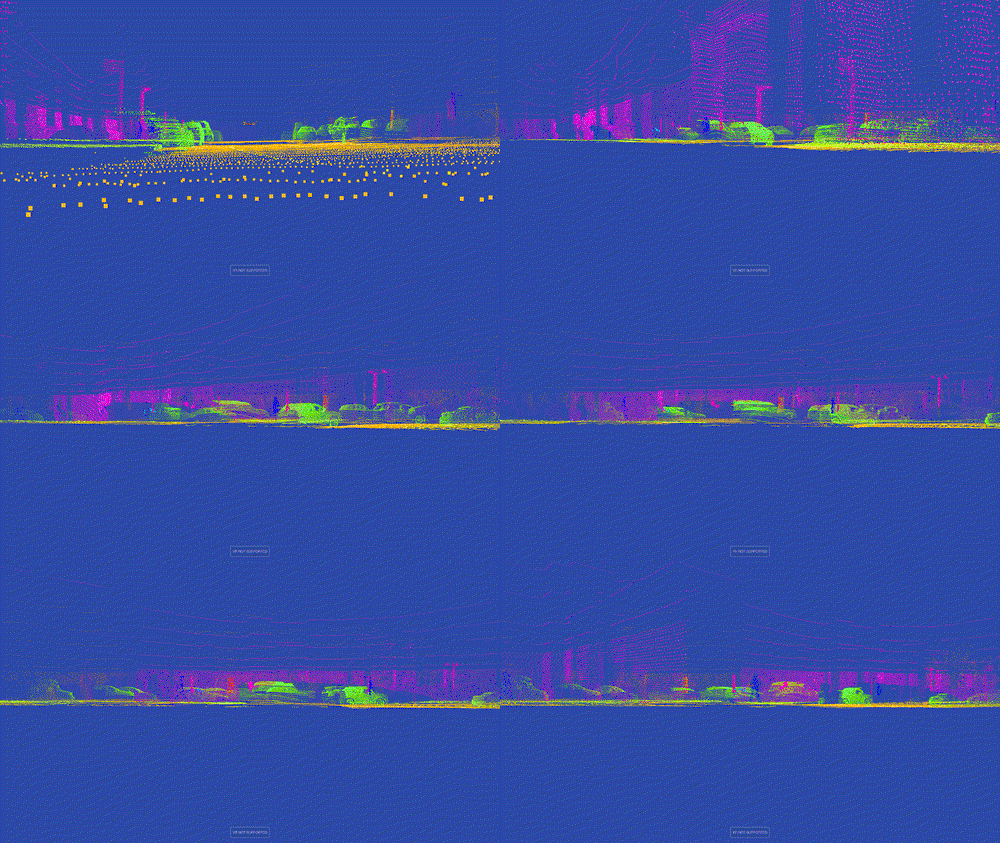
PandaSet RGB Point Cloud: High-quality autonomous driving dataset with full RGB colors from camera projection. Real urban scene with vehicles, pedestrians, and infrastructure. Read more

PandaSet Semantic Segmentation: Same scene with semantic labels - objects colored by category with 3D bounding boxes. Perfect for understanding autonomous driving perception.
How can I upload my own pointclouds?
You can host your own points - see how here. On that page it is described in what format your data should be.Exporting your own data is quite easy. Want to see some examples on how to export pointclouds? Take a look at:
- An example on how to subsample a numpy array
- This example to export a CSV file.,
- This export of a PLY file,
- This export of a neural network embedding,
- Export data from a self-driving car.
Why was this created?
AboutAlthough this was impressive, you still could not move around freely. This year Facebook launched the Oculus Quest, which is an untethered virtual reality headset! I bought it and adjusted my old code to finally be able to walk around in the data like I wanted
After a lot of positive feedback from others I made this into a website, so you can look at your own data as well. Enjoy!
More information:
In case you have any questions, feel free to reach out to me. My e-mail addres is: rolandmeertens@gmail.com