Interactive Jupyter Notebook Examples
Explore these ready-to-run examples to visualize different types of data in VR. Each example includes inline visualization and VR link generation.

🧬 Molecular Structures
Download real protein structures from the Protein Data Bank and explore them in VR. Visualize hemoglobin, insulin, DNA, and SARS-CoV-2 spike protein with atoms colored by element type.
- RCSB Protein Data Bank integration
- Biopython PDB parser
- Element-based coloring
- Inline rendering preview

✨ Astronomy & Star Catalogs
Generate synthetic star fields or query real astronomical data from the Gaia mission. Walk from our Sun to nearby stars and see constellations from different perspectives.
- ESA Gaia DR3 data integration
- Synthetic star field generation
- Famous nearby stars marked
- Star cluster creation

🏙️ LiDAR Urban Planning
Process and visualize city-scale LiDAR data. Color by elevation, classification (buildings, vegetation, ground), or intensity. Includes USGS 3DEP data integration.
- LAS/LAZ file format support
- Intelligent subsampling for VR
- Multiple color coding options
- Classification-based filtering
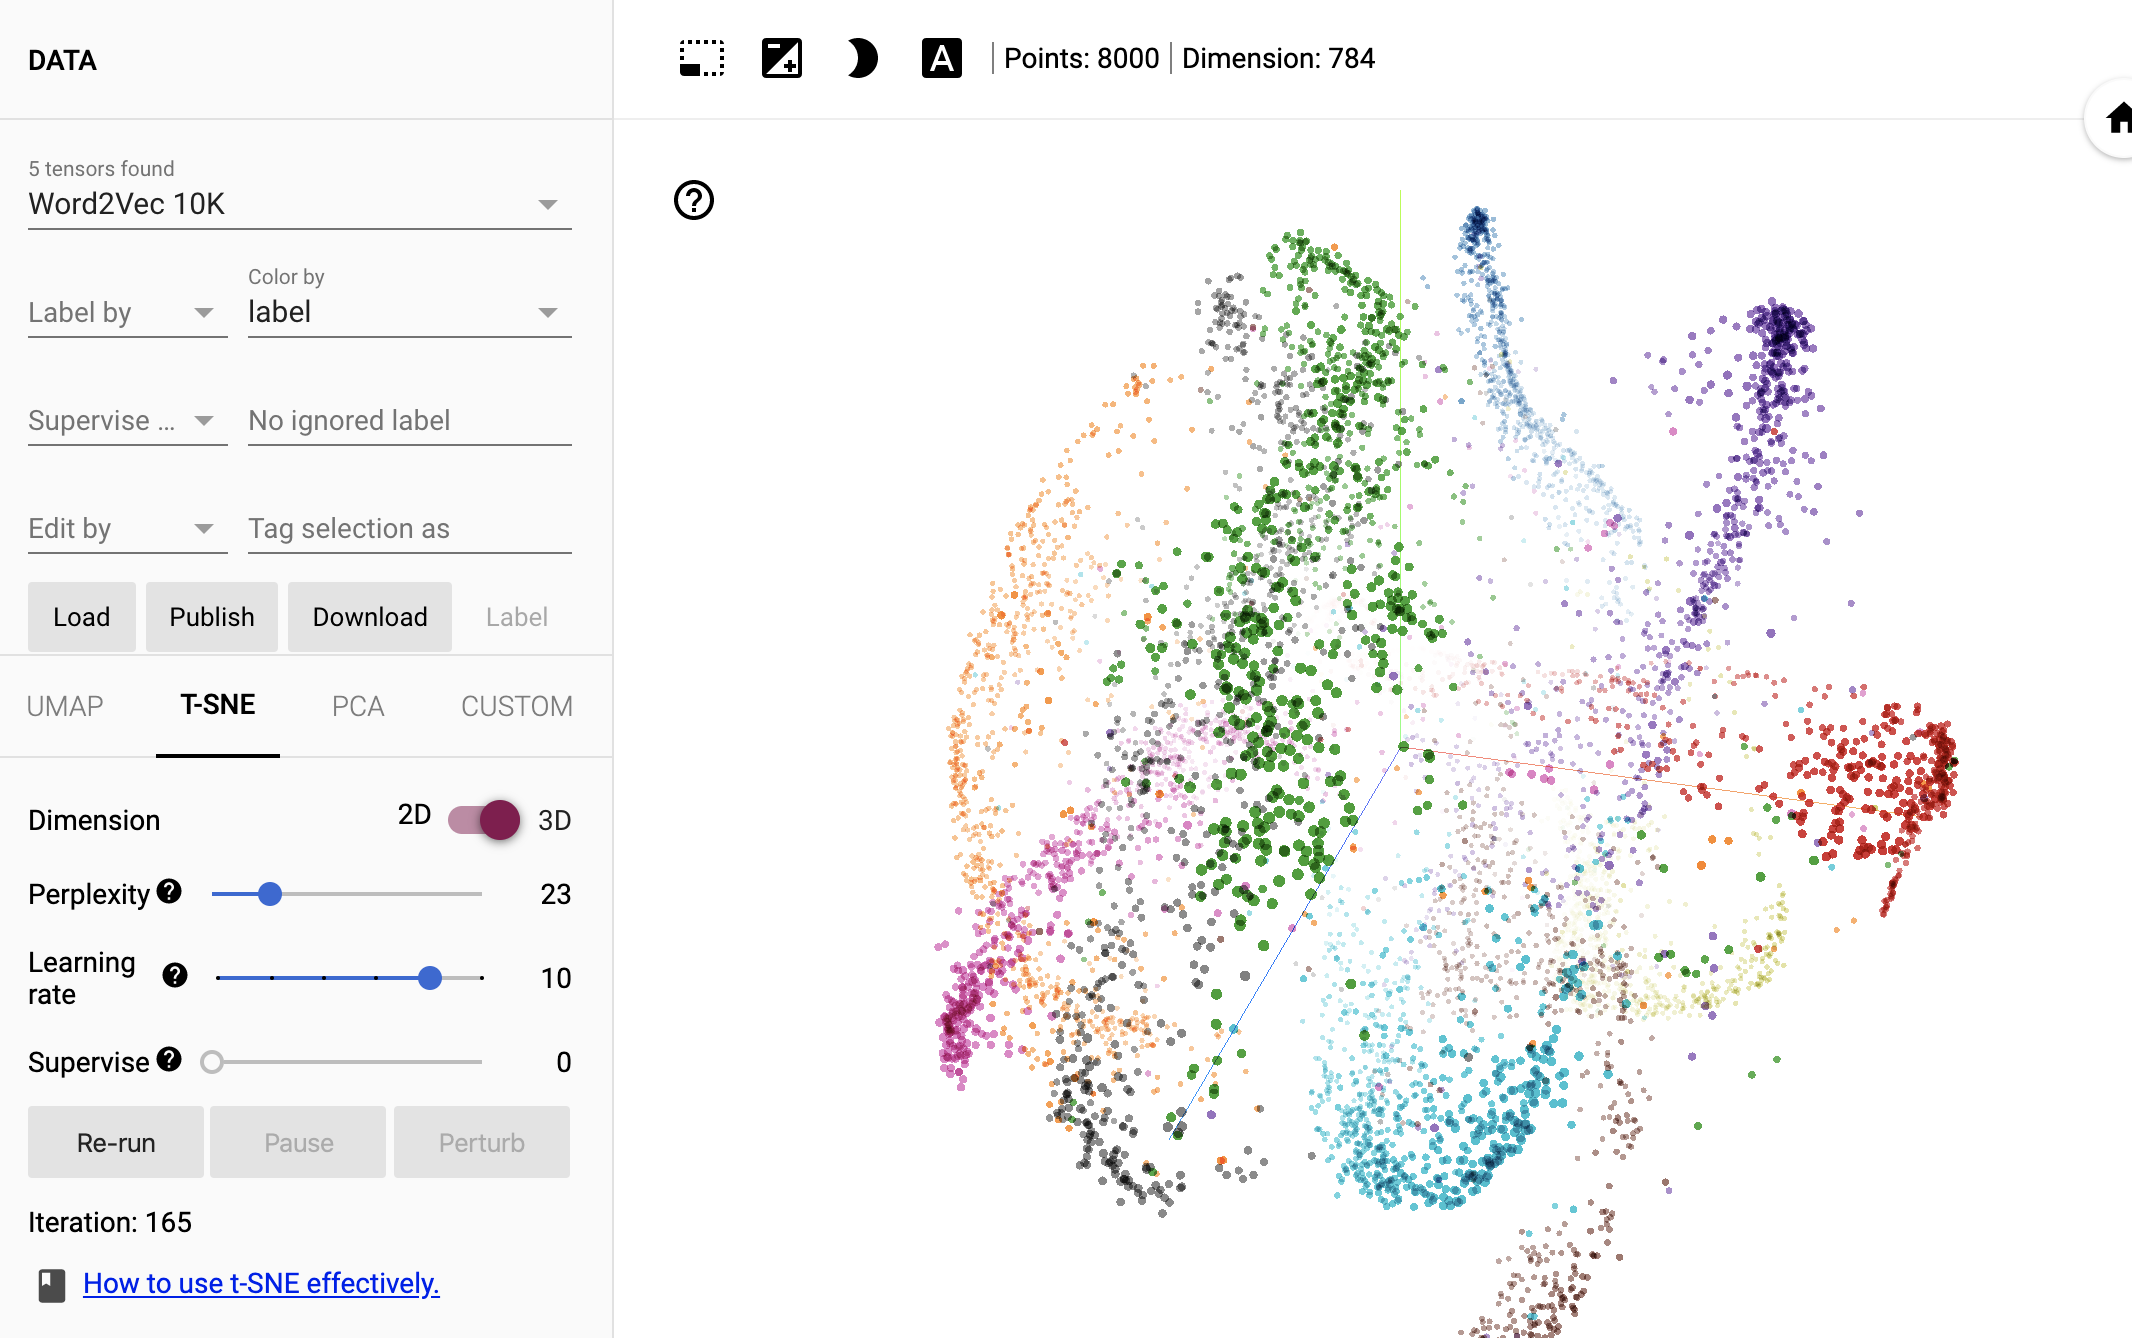
🤖 Machine Learning Embeddings
Visualize high-dimensional ML embeddings in 3D using t-SNE, UMAP, or PCA. Debug misclassifications and explore cluster structure in virtual reality.
- t-SNE, UMAP, and PCA support
- MNIST digit dataset included
- Color by labels or predictions
- Misclassification visualization

⚽ Sports Analytics
Analyze player movement and game events in 3D space. Use StatsBomb open data or generate synthetic tracking data. Create both 3D trajectories and 2D heatmaps.
- StatsBomb open data integration
- Synthetic tracking data generation
- 3D trajectory visualization
- 2D heatmap view

🎨 Inline Jupyter Rendering
Learn how to render point clouds directly in your Jupyter notebook before sending to VR. Preview your data with rotation and zoom controls.
- Interactive inline rendering
- Customizable point size and colors
- Background color options
- Simple API
Getting Started
All examples include automatic package installation and inline visualization. Simply open the notebook and run the cells!
Quick Start:
pip install immersivepoints
import immersivepoints as ip

# Create point cloud (N x 4: x, y, z, hue)
points = ...

# Render inline
ip.renderPoints(points, point_size=0.1)

# Generate VR link
ip.showVR(points)